
You turn the packet over, look at the grid on the back, and there are eleven numbers where you wanted one. Half of them are per serve, which is a serve nobody eats.
Food label reading comes down to one habit: compare the per 100 g column, or per 100 mL for liquids, and check five numbers before anything else. Energy in kilojoules, saturated fat, sugars, sodium and fibre. That single move strips out the marketing built into serving sizes and lets you compare two boxes of cereal, two jars of pasta sauce or two loaves of bread on the same terms. Australian law is on your side here. Food Standards Australia New Zealand requires every Nutrition Information Panel to show the average quantity per serve and per 100 g for energy, protein, total fat, saturated fat, carbohydrate, sugars and sodium.
If you do one thing today, pick up the product you buy most often, find the sodium and saturated fat per 100 g, and write both on your phone. That’s your reference point for every comparison after this.
Every packaged food sold in Australia carries the same skeleton of information, even though the layout moves around between brands. Knowing where each piece sits is the difference between skimming a label and reading one.
Fibre isn’t always compulsory, though most reputable brands include it. Vitamins and minerals appear when a manufacturer wants to make a claim about them.
Serving size sits at the top of the panel and deserves scepticism. Manufacturers set it themselves, and it rarely matches what a person eats in one sitting. A serve of chips might be 30 g when the packet holds 175 g. The per 100 g column exists precisely because of that. It’s the one figure every brand has to standardise, so it can’t be quietly reduced to make a product look leaner.
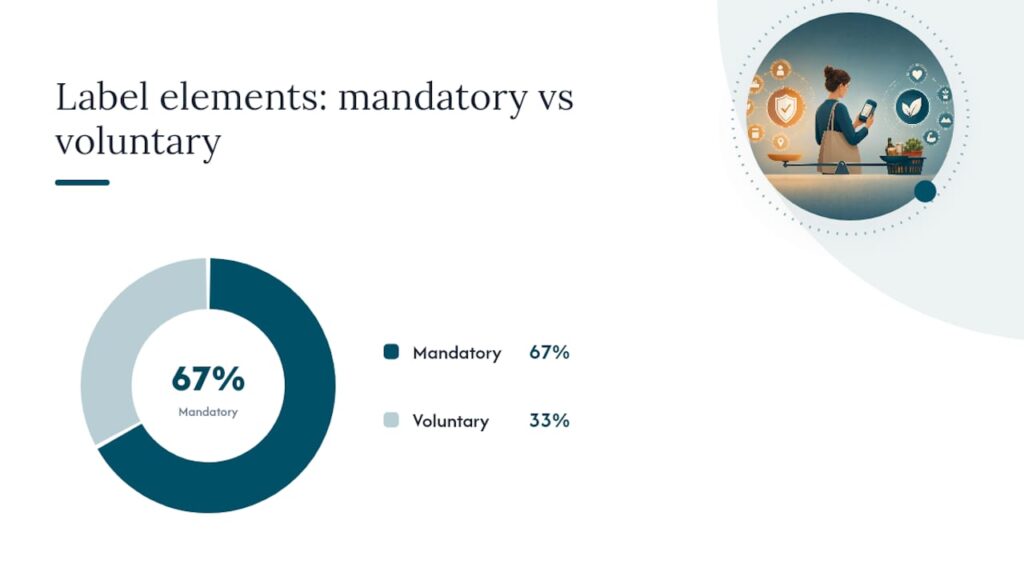
Beyond the panel, healthdirect’s guidance on food labels points to several elements worth checking:
| Label element | What it tells you | Mandatory? |
| Nutrition Information Panel | Energy, fat, sugar, sodium and more, per serve and per 100 g | Yes |
| Ingredient list | Everything in the product, heaviest first | Yes |
| Allergen statement | Presence of major allergens, usually in bold | Yes |
| Use-by or best-before date | Safety cut-off compared with a quality guide | Yes |
| Health Star Rating | Overall nutritional score, half a star to five stars | No, voluntary |
| Percentage Daily Intake column | Rough guide to how much of a daily target one serve provides | No, voluntary |
Once you know where the panel sits, the next skill is knowing what each row is telling you. Run through it in this order and you’ll spend less time squinting at fine print.
Energy in kilojoules measures how much fuel the food provides. It’s neither good nor bad on its own, and if weight is part of what you’re managing, lower energy per 100 g within a comparable food usually works in your favour. Protein supports muscle repair and fullness, so a higher figure is generally a plus in yoghurt, legumes and meat alternatives. Total fat covers every type of fat combined. Saturated fat is the subset worth watching, since diets high in it are linked with raised LDL cholesterol.
Carbohydrate and sugars sit together, with sugars a subset of the carbohydrate figure. Sodium is where you check salt content, because salt itself isn’t listed. Under Australian food standards, a product can only carry a low sodium claim at 120 mg per 100 g or less, which is a considerably tighter mark than the 400 mg per 100 g many shoppers use as a rough ceiling.
| Nutrient, per 100 g | Aim for | Watch out for |
| Energy, kJ | Lower, within the same food category | High kilojoules in a product marketed as light or diet |
| Saturated fat | Under 3 g as a working benchmark | Palm oil, coconut cream or butter high on the ingredient list |
| Sugars | Under 15 g as a working benchmark, fruit products run higher | Several sugar aliases inside the first five ingredients |
| Sodium | As low as practical, under 120 mg for a legally low product | Sauces, stocks, cured meats, bread |
| Fibre, per serve | 2 g or more to count as a source | Zero or unlisted fibre in a product sold as wholegrain |
Per 100 g is your comparison tool. Per serve is your portion-planning tool. NSW Health’s guidance on food labels recommends exactly that split: use the standardised column to decide which product is better, then switch to the per serve figure once you’ve chosen, so you know what you’re eating.
Pro Tip: To convert per 100 g to your real serve size fast, divide the serve weight by 100 and multiply by the per 100 g figure. A 45 g serve of a product listing 20 g of sugars per 100 g works out at 9 g per serve, roughly two teaspoons.
The ingredient list is ordered by weight from heaviest to lightest, which means the first three ingredients usually make up the bulk of the product. If sugar in any of its names sits inside that top three, treat the healthy-sounding claim on the front with caution.

Manufacturers rarely write sugar once and leave it there. Sweeteners appear as glucose, sucrose, dextrose, maltose, golden syrup, rice malt syrup and hydrolysed starch, and a product can list four or five of them separately so that none individually ranks as the top ingredient, even though together they outweigh everything else. Checking the ingredient list against the total sugars figure is the only way to work out whether that sugar is naturally occurring, as in plain milk or whole fruit, or added.
Sodium behaves the same way. Beyond plain salt, look for monosodium glutamate, baking powder and yeast extract, all common in sauces, stocks and processed snacks. Saturated fat turns up as palm oil, coconut oil, coconut cream or butter. If you see partially hydrogenated anywhere, that’s an older marker of trans fat which most reputable manufacturers have phased out and which is still worth spotting.
Additives have their own naming convention. FSANZ requires them to be declared by class name or code, such as Colour (Caramel I) or Emulsifier (472a), so they stay identifiable even when the chemical name means nothing to a shopper. Allergens get bolded rather than buried in code, which is a useful visual shortcut when you’re moving quickly.
Front-of-pack claims are where things get slippery. A low fat or reduced salt claim has to meet a specific legal threshold, and meeting that threshold says nothing about the rest of the nutrient profile.
| Claim | What it legally means | What to verify on the panel |
| Low fat | Meets a set maximum fat content | Check sugars, since fat is sometimes replaced with them |
| No added sugar | No sugar added during processing | Check ingredients for fruit juice concentrate, which still contributes sugar |
| Reduced salt | At least 25 per cent less sodium than the standard version | Confirm the sodium per 100 g figure is low, rather than only lower |
| High fibre | Meets a minimum fibre threshold per serve | Cross-check saturated fat and sugars, which can still be high |
| Source of protein | Meets a minimum protein threshold | Look at total energy and sugars in the same product |
The Health Star Rating is a front-of-pack score from half a star to five stars, designed to let you compare similar products at a glance without decoding the whole panel. It was developed by Australian federal, state and territory governments working with industry and public health groups, and the algorithm weighs energy, saturated fat, sugars and sodium against positive components including fibre, protein, and fruit and vegetable content.
It’s handy for a fast scan down an aisle, with two real limitations worth knowing.
Pro Tip: When a product carries no Health Star Rating at all, which happens more with smaller and imported brands, go straight to the per 100 g comparison and the ingredient list. That combination is always available, even when the star system isn’t.
This is the sequence to run when you’re standing between two near-identical products and your trolley is blocking the aisle.
Standing in an aisle squinting at eight-point type isn’t anyone’s idea of a good afternoon, and it’s the gap digital tools were built to close.
FoodSwitch is the standout. It’s a free barcode-scanning app that pulls up a product’s nutrition profile the moment you scan it and suggests alternatives within the same category, ranked on Health Star Rating logic. It’s most useful for building a shortlist of go-to brands over a few shops, rather than re-running the same comparison every week.
A few other habits are worth building in alongside it:
Some labelling tactics are legal and designed to nudge a snap judgement in the manufacturer’s favour. Recognising the pattern is most of the work.
Front-of-pack claims are voluntary and only useful once verified against the panel. A no added sugar claim on a fruit juice blend can still carry a substantial natural sugar load once fruit concentrate is added back in, and that sugar behaves the same way in your body regardless of where it came from.
The traps worth naming:
The five numbers don’t change with age. What changes is which of them earns the most attention.
Protein and fibre both become more useful to track in your forties and fifties. Muscle mass declines with age unless something is done about it, and protein intake is one of the two things that slows that decline, the other being resistance training. So on a yoghurt, a bread or a cereal, the protein and fibre figures are often more informative than the kilojoules. Sodium matters more too, because blood pressure tends to rise with age and, in women, the rise commonly steepens around and after menopause.
That’s a reasonable general steer rather than a personal target. What your own numbers should be depends on your blood results, your medications and what your GP is already monitoring, and no label-reading rule substitutes for that.
A label tells you what’s in a product. Whether that product suits you is a separate question, and it’s where general label literacy reaches its limit.
Some situations call for a conversation rather than another search:
Three questions worth bringing to a first appointment: how many kilojoules a day suit my goal and my activity level, which two or three numbers on a label matter most for my situation, and am I overestimating how healthy my usual brands are.
Reading labels well is a habit that pays off more with every shop, because the swaps become obvious and the traps stop working on you. It isn’t a skill you master once and file away.
The per 100 g rule on its own resolves most of the confusion. Shoppers get misled because serving sizes are engineered to mislead and nobody ever explained the workaround. Once that lands, the rest of the checklist, the star rating, the ingredient aliases, the claims, becomes detail on top of a solid foundation.
Where general advice falls short is in treating every shopper’s ideal numbers as identical. Someone managing high blood pressure needs a much stricter sodium ceiling than someone focused on weight. Someone with PCOS may want to weight the sugars column more heavily than the fat column. A label can’t tell you which of those you are.
Check the Nutrition Information Panel’s per 100 g column for energy, saturated fat, sugars and sodium, then read the ingredient list, which runs from heaviest ingredient to lightest. Use the per serve column only after you’ve chosen the product, to work out portions.
FoodSwitch scans barcodes and shows a product’s nutrition profile alongside alternatives in the same category. Most major Australian supermarket apps also carry the full panel on their product pages, which lets you compare before you shop.
It comes from United States labelling, where the Nutrition Facts panel shows a Percent Daily Value column: 5 per cent or less counts as low in a nutrient, 20 per cent or more counts as high. Australian panels don’t carry Percent Daily Value, so the rule doesn’t transfer directly. The Australian equivalent is comparing the per 100 g column against nutrient benchmarks, for instance under 120 mg of sodium per 100 g for a low sodium product.
Compare the per 100 g column against working benchmarks: under 3 g of saturated fat, under 15 g of sugars, low sodium, and at least 2 g of fibre per serve. Then use the per serve figures to plan realistic portions. Those benchmarks are rules of thumb for everyday packaged food rather than legal definitions, apart from the sodium figure.
If you’re managing a health condition, working toward a specific weight goal, or dealing with multiple allergies, general label rules stop being enough. A practitioner can set targets against your own results and medications, and can tell you which two or three numbers on a pack are the ones that matter for you.
The per 100 g column, read against saturated fat, sugars, sodium and fibre benchmarks, is the most reliable way to compare packaged foods and make swaps that hold up.
| Point | Details |
| Compare per 100 g, not per serve | Serving sizes are set by manufacturers and vary widely. Per 100 g is the only standardised figure on the panel. |
| Use five numbers | Energy in kilojoules, saturated fat, sugars, sodium and fibre, checked before anything on the front of the pack. |
| The star rating supports the panel | The Health Star Rating is a fast category comparison. Confirm it against the per 100 g figures before deciding. |
| Read the ingredient list for aliases | Sugar and sodium appear under many names, and splitting them across several entries keeps any one of them out of the top three. |
| Read progress on more than the scale | Labels change what goes in the trolley. Whether it’s working shows in energy, symptoms, blood results and weight trends together. |
| Where BBN fits | A $49 Health Check with Maria, our owner and Health Coach, reviews your symptoms, history and eating patterns to work out what deserves attention first, with body composition measured at our Perth clinic. |
Check the kilojoules on the pack is advice almost every woman has been given, usually with a daily number attached. It addresses the Body pillar squarely, it’s arithmetically sound, and it works for a while. People who start reading labels do eat differently, and the shopping trolley does change.
What it never mentions is everything sitting around the trolley. It’s silent on Biology, on the hormonal shift through perimenopause that changes appetite, insulin handling and how much muscle you hold, so that the same kilojoule figure produces a different result at fifty-two than it did at thirty-eight. It’s silent on Brain, on the stress load and the dieting history that decide what happens at nine at night regardless of what the packet said. And it’s silent on Behaviour, on who does the shopping, how tired you are when you do it, and what’s within arm’s reach when you get home. Advice built on one pillar is incomplete rather than incorrect, and that’s the honest reason a strict label-reading month works and the third month doesn’t.
The BBN Bridge names all four, in this order: Biology, Brain, Body and Behaviour. Midlife tends to change every one of them inside a few years. A packet can tell you what’s in it. It can’t tell you which of the four is doing the most work in your case.
BBN’s practitioners are nutritionists, clinical nutritionists and Accredited Practising Dietitians. Label reading comes up in most subsequent appointments, usually because someone is doing it carefully and getting nowhere. What we look at is the pattern rather than the packet: which four or five products account for most of the sodium, saturated fat or added sugar in a week, whether protein and fibre are anywhere near useful numbers, and which swaps would actually survive a bad Tuesday.
At our Perth clinic an InBody 570 body composition scan gives a baseline for muscle, body fat and fluid separately, so that changes in the trolley can be read against something more informative than scale weight. Telehealth appointments cover the same detailed review without the scan. Some services may be eligible for funding depending on the practitioner, the service, your referral, the funding criteria and your individual cover.
Reading labels well takes you a long way, and it stops short of telling you what your own numbers should be. Two women can put identical trolleys through the checkout and need different things, because muscle mass, blood results, medications, sleep and stress differ underneath. That part isn’t visible from the outside, which is why the same careful shopping produces different results for different people.
That is what our $49 Health Check is for.
Every BBN client starts with a private 45-minute appointment with Maria, our owner and Health Coach. Together, you will look at your symptoms, health and weight history, sleep, energy, eating patterns, movement and what you have already tried.
At our Perth clinic, your appointment includes an InBody 570 body composition scan. This allows us to look at muscle, body fat and fluid separately, rather than averaging everything into one number.
You will leave with a clearer understanding of:
You won’t be handed a generic plan or pressured to sign up for anything. The Health Check is designed to help you understand your starting point before you spend more time, money and effort on an approach that may not fit.
Telehealth appointments include the same detailed review of your symptoms, history and priorities, without the body composition scan.
45 minutes. $49. Measure, don’t guess.
This article provides general nutrition information rather than individual clinical advice. Speak with your GP or an appropriately qualified practitioner about your own situation.
Kickstart Your Journey to Better Health with Our Balanced Health Blueprint Consult – $49 (valued at $139)